
Self-service BI
From your databases to published dashboards, in one platform
dots connects to the databases you already run, lets you define your business metrics once, and gives every team dashboards, OLAP (pivot) analysis and KPI scorecards. Run it on Azure or on your own servers.
How dots works
Connect
Add a Data Source: SQL Server, Azure SQL, PostgreSQL, MySQL/MariaDB or Oracle. Or upload a CSV.
Curate
Save a query as a Data View. dots stores a copy of the result, so analysis runs on that copy, not on your live database.
Model
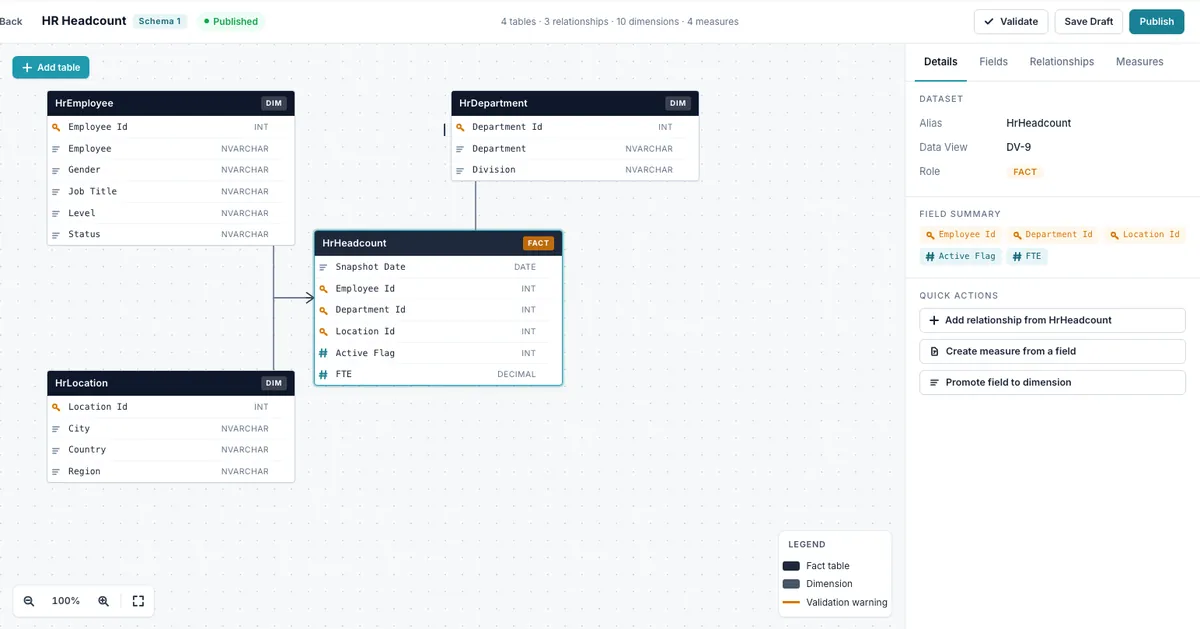
Build a Semantic Model: join your Data Views and define measures once for everyone.
Publish
Design a Dashboard from 12 widget types, preview the draft, then publish. Viewers only see the published version.
More than dashboards
- dots
- Department
- Year
- Headcount
Department 2024 2025 2026 Finance 58 61 64 HR 22 24 25 Sales 131 140 152 Operations 176 182 190 Send to DashboardOLAP analysis
Pivot any Semantic Model by rows, columns and measures, switch between grid and chart, and send the result to a Dashboard.
- dots78%
- FinancialOn track
- CustomerOn track
- Internal processAt risk
- Learning & growthOn track
Business Performance
Run a balanced scorecard: perspectives, objectives and weighted KPIs with targets and red/green thresholds.
- dotsBranches
Title City Region Heliopolis Cairo Central Smouha Alexandria North Assiut Assiut South Add rowMaster Data Management
Let business users define their own reference tables and relations, and maintain the rows without a developer.
Schema-based security
Group data into schemas and assign them per user. People only see the Data Views, Semantic Models and Dashboards in their schemas.
Cloud or on your own servers
Use dots on Microsoft Azure, or install it on servers you control when your data can't leave your network. Either way, database passwords are encrypted at rest and never displayed again, and dashboards read from a stored copy of your data, not from your production systems.
How deployment worksNeed help getting your data ready?
Our team also builds the data work behind the dashboards.
Data warehouses
Design and ETL on SQL Server, MySQL or PostgreSQL.
Data science
Predictive models in Python and R.
Dashboards & reports
Built on Power BI, Tableau, Qlik, SSRS or Crystal Reports.
See dots in action
A short video introduction to dots.

Plays from YouTube, which may set cookies.
Book a demo with our team
Tell us what you report on today. We'll show you how it would work in dots.